Build Verification Guide
How to test & benchmark your new PC. — Stable. Within spec. Worth what you paid.
A brand-new build deserves a week of testing — not to brag on Reddit, but to catch the 3.4% of components that fail within the return window. The bar is simple: stable, within 10% of expected, no thermal alarm.
- stress test
- 30-60 min
- +AIDA64
- 3DMark+Cine
- healthy range
- ±10%
Why test your new build
A new PC arrives, you turn it on, it boots, you celebrate. Most builds are fine. But "most" isn't all — components fail, fans don't spin up, RAM kits ship with a bad stick, GPUs have manufacturing defects. The first week of testing has one job: catch the 3-4% of builds that have a problem while you're still inside the return window.
Testing also gives you:
- Performance baselines for future comparison — if your PC feels slower in 12 months, you'll know whether that's drivers, software bloat, or actual hardware drift.
- Thermal headroom verification — if your cooler is mounted wrong or your case airflow is poor, stress testing reveals it before a real game session at midnight.
- Confidence in the build — running a heavy workload and seeing temps stay in spec is the difference between "I think it's fine" and "I know it's fine".
Total time investment: ~3-4 hours of testing spread across the first week. Cheap insurance.
Stability testing — Prime95, MemTest86, FurMark
Stability testing throws sustained heavy load at one component at a time to surface any hidden defect. The components fail under load in ways they don't fail at idle.
CPU — Prime95 small FFTs
Prime95 (free, prime95.com) runs intensive floating-point math that pushes the CPU to maximum sustained load. Use the Small FFTs stress test preset — this is the most CPU-intensive without involving RAM heavily.
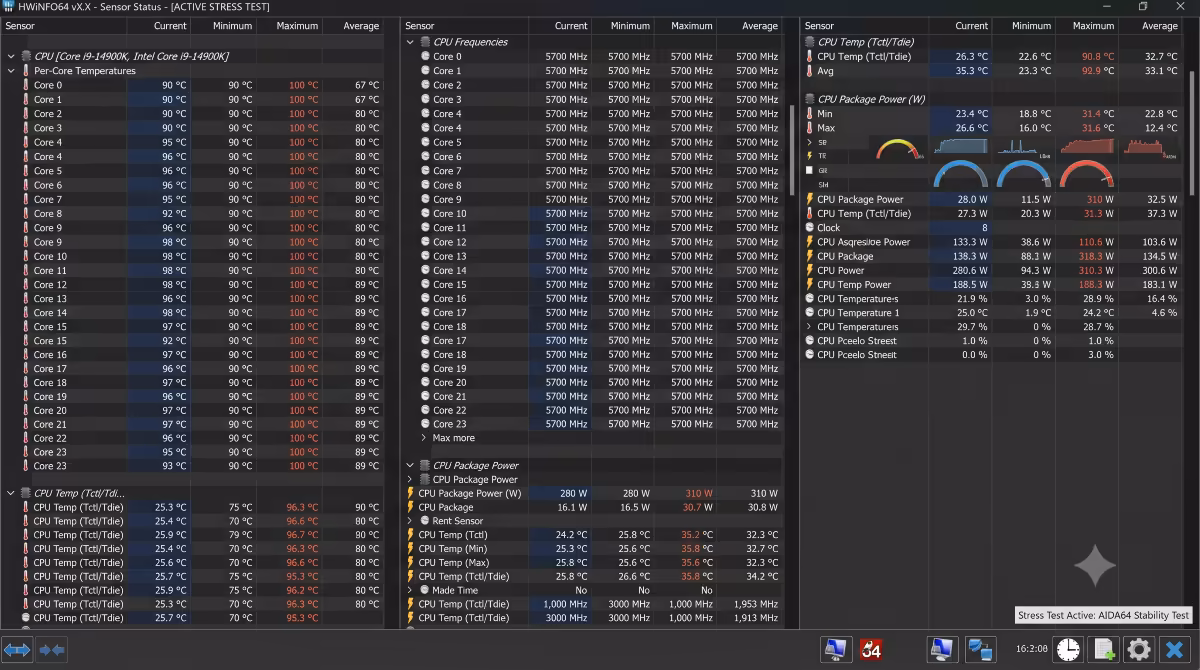
Run for 30-60 minutes with HWMonitor or HWiNFO64 open in another window to watch temps. Healthy result:
- No errors reported by Prime95.
- CPU temp stays under 85°C sustained (95°C+ means thermal issues).
- Clock speeds stay near the all-core boost (small dips are normal).
- No system crashes, BSODs or reboots.
RAM — MemTest86
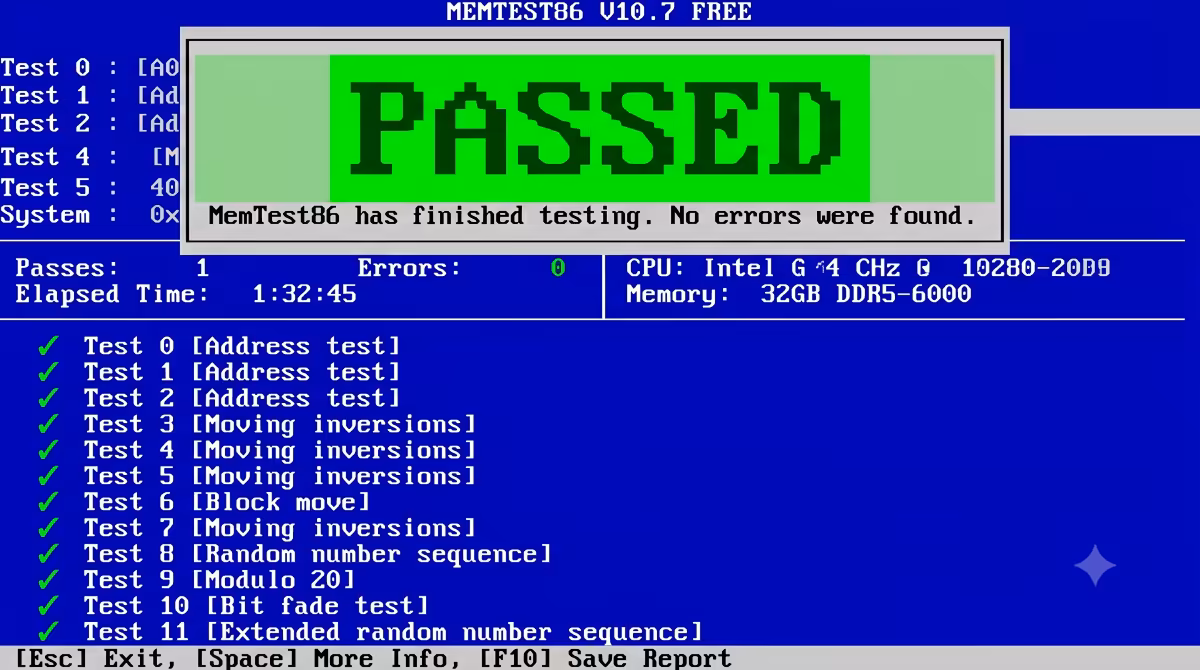
MemTest86 (free, memtest86.com) runs from a bootable USB stick, outside of Windows. This is the gold standard for memory testing because the OS doesn't interfere.
Create a bootable USB with the MemTest86 image, boot from it (set USB first in BIOS boot order), let it run. One full pass minimum — usually 60-90 minutes for 32GB at DDR5-6000. If you suspect issues, leave it running overnight (8+ hours, 8-10 passes).
Healthy result: zero errors after at least one full pass. A single error means the RAM, the motherboard memory slot, or the XMP/EXPO profile has an issue.
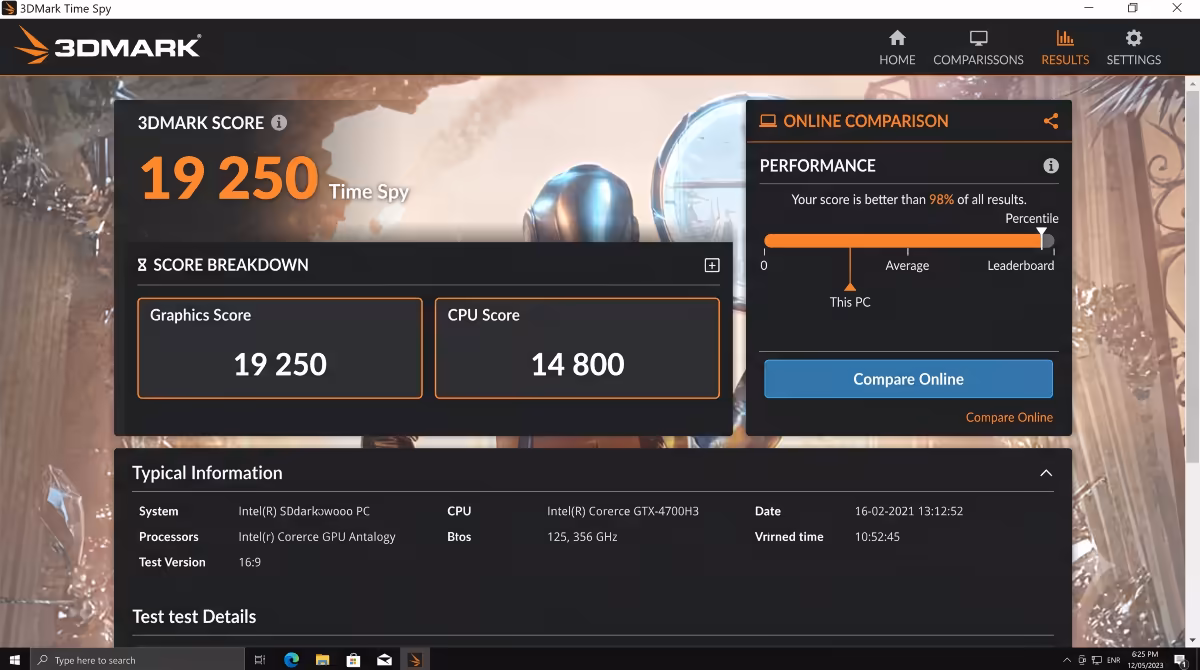
GPU — 3DMark Time Spy Stress Test or FurMark
3DMark Time Spy Stress Test (paid 3DMark, ~R450 on Steam) runs Time Spy 20 times in a row and reports a stability score. 97%+ is healthy.
FurMark (free, geeks3d.com) is the classic GPU torture test — pushes the GPU to its thermal and power limit. Run for 20-30 minutes; watch for:
- No visual artefacts (random pixels, lines, colour blocks).
- GPU temp under 85°C (above 90°C suggests airflow/cooler issues).
- No system crashes or driver timeouts.
- Frame rate stable (small variation OK; large dips suggest throttling).
Performance baselines — 3DMark, Cinebench, AIDA64
Stability passes. Now measure how fast the build actually is.
| Tool | What it tests | Cost |
|---|---|---|
| 3DMark Time Spy / Steel Nomad | GPU + CPU gaming performance | Free demo / R450 full |
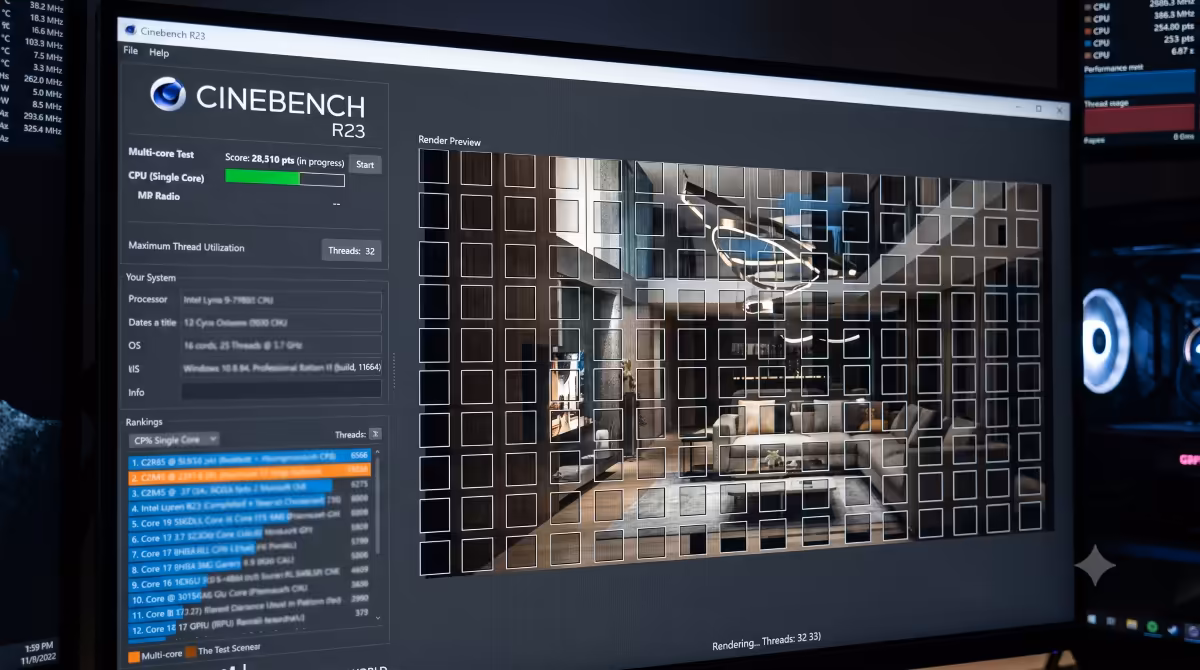
| Cinebench R23 (or R24) | CPU multi-core and single-core render | Free |
| AIDA64 Cache & Memory | RAM bandwidth + latency | 30-day trial / R900 |
| CrystalDiskMark | SSD/NVMe read & write speeds | Free |
| Geekbench 6 | Cross-platform CPU + GPU compute | Free |
| 3DMark CPU Profile | CPU at 1, 2, 4, 8, 16-thread loads | Free demo |
Recommended order:
- 1. 3DMark Time Spy — single most universal gaming benchmark. Get a Graphics score and CPU score; compare both to online median for your exact spec.
- 2. Cinebench R23 (or R24) — multi-core and single-core CPU scores. Quick (10 minutes) and matches well to real productivity workloads.
- 3. AIDA64 Cache & Memory — verify XMP/EXPO is delivering rated bandwidth. DDR5-6000 should show ~85-95 GB/s read; if you see 60-65 GB/s, XMP is off.
- 4. CrystalDiskMark — verify SSD speed. Gen 4 NVMe should hit 6,000-7,000 MB/s sequential read; Gen 5 NVMe 12,000-14,000 MB/s.
- 5. Geekbench 6 — useful for cross-platform comparison if you're researching upgrade impact later.
Game benchmarks
Synthetic scores prove components work to spec. Game benchmarks prove your actual experience matches review-site expectations.
- Cyberpunk 2077 — built-in benchmark, demanding on both CPU and GPU. Path tracing torture test for high-end builds.
- Forza Horizon 5 — built-in benchmark, well-optimised, useful for verifying expected FPS bands.
- F1 2024 — built-in benchmark, easy DLSS/FSR comparison.
- Black Myth Wukong — built-in benchmark tool, modern UE5 workload.
- Total War: Warhammer III — campaign benchmark, CPU-heavy.
- Counter-Strike 2 (CS2) — Workshop benchmark maps for FPS measurement at competitive settings.
Compare your results to YouTube benchmark videos for your exact GPU+CPU combination. If a reviewer with a similar spec reports 95 FPS at 1440p Ultra and you're seeing 70 FPS, dig into the difference: drivers, settings, thermal throttling, XMP, GPU PCIe speed.
Real-game soak test
Synthetics run for 20-30 minutes. Soak tests run for 1-2 hours of real gameplay. The two catch different problems.
Run an actual game session of 1-2 hours in something you enjoy. Watch for:
- Frame rate hitches, micro-stutters or sudden drops.
- Driver timeout errors (TDR) — Windows reports "Display driver has stopped responding".
- Thermal creep — temps slowly rising past 85°C as the case heats up.
- Fan noise escalating to unusable levels.
- Game crashes to desktop.
- Sudden reboots or BSODs.
A build that passes Prime95, MemTest, 3DMark and a 90-minute Cyberpunk session is genuinely healthy.
Where to compare scores
Your score is meaningless without context. These sources give you honest comparisons:
- 3DMark online database — official, automatically populated by users worldwide. Filter by your exact GPU and CPU to see percentile rank.
- PCPartPicker community benchmarks — users post their builds with scores; useful for full-system comparison.
- Geekbench Browser — every Geekbench run is publicly searchable. Compare to identical hardware.
- Cinebench R23 leaderboards — Maxon publishes single-core and multi-core leaderboards by CPU model.
- YouTube benchmark videos — channels like Hardware Unboxed, Gamers Nexus, Optimum and Daniel Owen publish per-game FPS data for nearly every CPU+GPU combo at multiple resolutions.
What good results look like
"Healthy" is a range, not a number. Hardware variance, BIOS revisions, ambient temperature, fan curves and background processes all contribute small differences. The right mental model:
| Score vs expected median | Interpretation | Action |
|---|---|---|
| Within ±5% | Right on target | No action needed |
| 5-10% above expected | Excellent silicon, well-tuned | Celebrate |
| 5-10% below expected | Normal hardware variance | Check temps, XMP, drivers |
| 10-20% below expected | Something is off | Investigate (see red flags) |
| 20%+ below expected | Real problem | Troubleshoot or RMA |
Red flags vs healthy variance
Common causes of 10-20% under-spec performance:
- XMP/EXPO disabled. RAM running at JEDEC baseline. Single biggest performance hit on Ryzen especially. Fix in BIOS.
- GPU at PCIe x4 instead of x16. Check GPU-Z's bus interface readout. If it shows x4 or x8, you've probably plugged the GPU into the second PCIe slot. Move to the top slot.
- Resizable BAR disabled. 2-5% gaming hit. Fix in BIOS.
- Power plan set to Balanced or Power Saver. Should be Ultimate Performance or High Performance. Check in Windows Power Options.
- Cooler not properly mounted. CPU thermal throttling at 95°C+ caps performance. Re-seat cooler, fresh paste.
- Background processes. Antivirus scans, OneDrive sync, Windows Update can tank benchmark scores. Re-run benchmarks with these paused.
- Stale GPU drivers. Update to latest Nvidia / AMD / Intel Arc drivers before benchmarking.
When to RMA
After ruling out configuration issues, persistent under-performance or instability is a hardware problem. RMA candidates:
- Dead on arrival. Component shows no signs of life — CPU fan doesn't spin (CPU dead), no display output (GPU or motherboard), drive not appearing in BIOS (SSD/NVMe dead).
- MemTest86 errors after at least 2 retests at different speeds. One stick is bad.
- GPU artefacts in stress test. Random pixels, lines, colour blocks during FurMark or 3DMark = dying GPU memory or core.
- Fan stopped spinning on day 1. Case fan, AIO pump, GPU fan — any fan that doesn't spin from cold boot is faulty.
- CrystalDiskMark shows <20% of expected SSD speed. Verify the SSD is in the right M.2 slot (some boards have a Gen 3 slot mixed with Gen 4/5).
- Persistent instability after BIOS reset to defaults, XMP off, clean Windows install.
In SA, RMA the component to where you bought it within the return window (typically 7-14 days). Most SA retailers including Evetech, Rebel Tech, Wootware and Takealot have a no-quibble return policy for clearly defective parts.
Free SA-friendly benchmark tools
Everything in this guide is free or has a free mode that covers what you need. No download from suspicious "warez" sites required.
| Tool | Free mode covers | Where to download |
|---|---|---|
| Prime95 | Full stability testing | prime95.com (official) |
| MemTest86 | Full memory testing | memtest86.com (free edition) |
| 3DMark | Time Spy, Steel Nomad demo runs | Steam (free demo) |
| Cinebench R23 / R24 | Full benchmark | Microsoft Store / maxon.net |
| AIDA64 Extreme | 30-day full trial | aida64.com |
| CrystalDiskMark | Full SSD benchmark | crystalmark.info |
| Geekbench 6 | CPU + Compute | geekbench.com |
| FurMark | Full GPU torture test | geeks3d.com |
| HWiNFO64 | Full system monitoring | hwinfo.com |
Common testing mistakes
Running stress tests without monitoring temps. Pointless. Always have HWiNFO64 or HWMonitor open to capture max temps during the run.
Benchmarking with antivirus / OneDrive / Discord overlay running. Background processes can drop 3DMark scores 5-10%. Close non-essential apps before testing.
Comparing to UserBenchmark. Use 3DMark, Geekbench Browser or Cinebench official leaderboards instead.
Treating a single benchmark run as definitive. Run twice; if there's >5% variance between runs, run a third. Background activity or thermal state can affect single runs.
Not updating GPU drivers before testing. Day-1 driver vs latest can differ 5-15% in benchmarks. Update first.
Testing on an unconfigured BIOS. XMP off, Resizable BAR off, CSM on — these all hurt scores. Set BIOS up first (see our BIOS setup guide), then benchmark.
Key takeaways
- Stability first — Prime95 30-60 min, MemTest86 one full pass, GPU stress 20-30 min.
- Performance baseline with 3DMark + Cinebench + AIDA64 + CrystalDiskMark.
- Within 10% of online median = healthy. 20%+ below = something is wrong.
- Real-game soak test 1-2 hours catches what synthetics miss (thermal creep, driver crashes).
- Catch DOA components within 7-14 days while still in the return window — 94% catch rate when you test, 41% when you don't.
Frequently asked questions
How long should I stress test a new PC?
30-60 min Prime95 (CPU), one full MemTest86 pass (RAM, 60-90 min), 20-30 min FurMark / 3DMark Stress Test (GPU). All under 85°C, no errors, no crashes.What benchmark scores should I expect?
Within 10% of online median for your exact GPU+CPU. Check 3DMark database, PCPartPicker or YouTube reviews. 20%+ below means thermal throttling, XMP off, GPU at wrong PCIe speed or DOA hardware.Which benchmark tools should I run on a new build?
Stability: Prime95, MemTest86, FurMark. Performance: 3DMark Time Spy, Cinebench R23, AIDA64, CrystalDiskMark, Geekbench 6. All free or with free modes.Is UserBenchmark a reliable benchmark site?
Not anymore. Use 3DMark database, Geekbench Browser or Cinebench official leaderboards instead.When should I RMA a new PC component?
DOA, persistent instability after clean config, MemTest errors at JEDEC, GPU artefacts in stress test, fan stopped spinning, SSD shows under 20% expected speed. Catch within 7-14 days return window.What temperatures are dangerous during stress testing?
Modern Ryzen/Intel routinely hit 85-95°C under load — normal. Trouble starts at sustained 100°C+ (cooler not mounted properly, no paste, dead pump). GPU 75-85°C healthy, above 90°C suggests airflow issues.Should I benchmark games or synthetic tools?
Both. Synthetics give comparable scores; game benchmarks tell you real-world FPS in what you actually play. Always finish with a 1-2 hour real-game soak test.Are free benchmark tools enough?
Yes for first-week verification. Free 3DMark demo + free Cinebench R23/R24 + 30-day AIDA64 trial + free CrystalDiskMark + free Prime95/MemTest cover everything you need.