SA Reality · Eskom kWh Math
What gaming actually costs. — Real Eskom rates. Real wattage. Real Rands.
Forum mythology says your gaming PC is "eating your electricity bill". The actual maths is less dramatic — a mid-range build at SA's 2026 rates costs about a Nando's quarter chicken a week to run.
- avg block 2 tariff
- R3.50/kWh
- /month typical
- R110-180
- undervolt savings
- -18%
The real wattage of a gaming PC
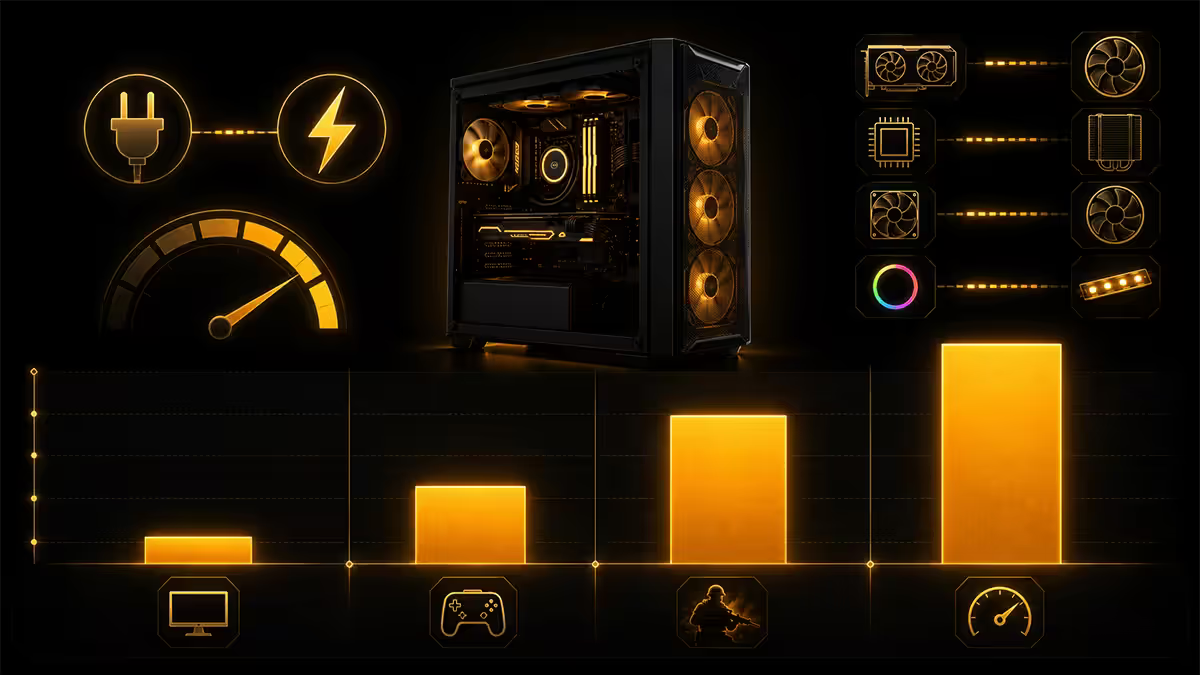
Forum chats love the headline number on the GPU box — "RTX 5080: 360W TDP!" — and conclude the whole system must draw 700W constantly. Real measurement is more boring and a lot less expensive.
A modern gaming PC has four distinct power states:
Idle — desktop, browser, music. Modern AMD and Intel chips clock down aggressively. A Ryzen 7 7700 + RTX 5070 Ti system reads 70-95W at the wall when not gaming. Web browsing nudges it to 100-120W when scrolling YouTube.
Light gaming or older titles — CS2, Valorant, indie games, esports at 1080p. GPU loads 30-50%, CPU loads 30%. Wall draw 180-260W. A two-hour CS2 session on a mid-range build draws roughly 0.45 kWh — about R1.60 of electricity.
AAA gaming — Cyberpunk 2077, Black Myth Wukong, Alan Wake 2 at 1440p Ultra. GPU 90-100%, CPU 50-70%. Wall draw 350-500W for mid-range builds, 500-700W for high-end. A two-hour AAA session draws roughly 0.85-1.4 kWh — R3-R5 of electricity.
Stress / synthetic / heavy creator — Cinebench, Furmark, Blender render. Both CPU and GPU at 100%. Wall draw 450-600W mid-range, 700-900W high-end. Most users never hit this state in normal use.
| System tier | Idle | AAA gaming | Stress test |
|---|---|---|---|
| Budget (R15-20k build) | 55-75 W | 220-310 W | 320-380 W |
| Mid-range (R25-40k) | 70-95 W | 280-380 W | 400-500 W |
| High-end (R45-65k) | 95-130 W | 420-560 W | 600-780 W |
| Enthusiast (R70k+) | 130-180 W | 540-720 W | 800-1050 W |
How Eskom IBT actually charges you in 2026
South Africa's Inclining Block Tariff (IBT) is designed to discourage heavy use. The more you consume in a month, the more each additional kWh costs. Block thresholds and exact pricing vary by municipality — these are typical urban values for 2026 (City of Tshwane, City of Joburg, City of Cape Town residential prepaid). Your supplier's tariff will be very close but not identical.
| Block | Monthly kWh | Approx 2026 tariff |
|---|---|---|
| Block 1 | 0 - 350 kWh | ~R2.85 per kWh |
| Block 2 | 351 - 600 kWh | ~R3.35 per kWh |
| Block 3 | 601 - 1,000 kWh | ~R3.85 per kWh |
| Block 4 (top) | 1,001+ kWh | ~R4.40 per kWh |
An average SA two-person household uses 450-650 kWh/month — meaning most gaming PCs run their incremental hours at Block 2 to Block 3 rates, around R3.35-R3.85 per kWh. A heavy household (geyser daily, pool pump, three teenagers gaming) sits in Block 3 to Block 4.
For the rest of this guide, we'll use R3.50/kWh as a fair national average for incremental gaming hours. Adjust upward by ~10% if your household typically blows past 600 kWh/month.
Monthly cost — real numbers
Three example builds, three use patterns, three monthly bills:
Casual gamer — mid-range build, 2 hrs/day gaming + 3 hrs browsing
Gaming: 300W × 2h × 30 days = 18 kWh. Browsing: 100W × 3h × 30 = 9 kWh. Idle/sleep balance: ~3 kWh. Total: ~30 kWh × R3.50 = R105/month.
Enthusiast — high-end build, 3 hrs/day AAA + 4 hrs browsing/work
Gaming: 500W × 3h × 30 = 45 kWh. Browsing/work: 120W × 4h × 30 = 14.4 kWh. Idle: ~5 kWh. Total: ~64 kWh × R3.50 = R225/month.
Streamer / content creator — high-end + always-on, 5 hrs gaming + 6 hrs work + extended idle
Gaming: 550W × 5h × 30 = 82.5 kWh. Work/render: 250W × 6h × 30 = 45 kWh. Always-on idle: 75W × 13h × 30 = 29 kWh. Total: ~157 kWh × R3.50 = R550/month.
Note: a streamer's number above tips well into Block 3 territory, meaning the marginal cost is actually closer to R3.85/kWh — push the bill to roughly R605/month. Not negligible, but tax-deductible as a business expense for active SA creators.
Monitors and peripherals — small but real
The PC is the headliner; the supporting cast adds up.
| Device | Typical draw | Cost if on 8 hrs/day |
|---|---|---|
| 27" 4K IPS monitor | 35 - 55 W | R37 / month |
| 32" OLED gaming monitor | 60 - 90 W | R65 / month |
| Dual 27" 1440p setup | 65 - 95 W combined | R67 / month |
| Mechanical keyboard (RGB on) | 3 - 6 W | R3 / month |
| Gaming mouse (RGB) | 1 - 2 W | R1 / month |
| Headset (USB) | 2 - 4 W | R2 / month |
| Speakers (small 2.0 powered) | 8 - 15 W | R10 / month |
| Stream deck / RGB accessories | 3 - 8 W | R5 / month |
An honest peripheral overhead for a typical desk setup is R50-R90/month on top of the PC itself. The OLED monitor is the only big peripheral mover — and it's worth it for the picture.
Sleep vs idle vs shutdown — the biggest free saving
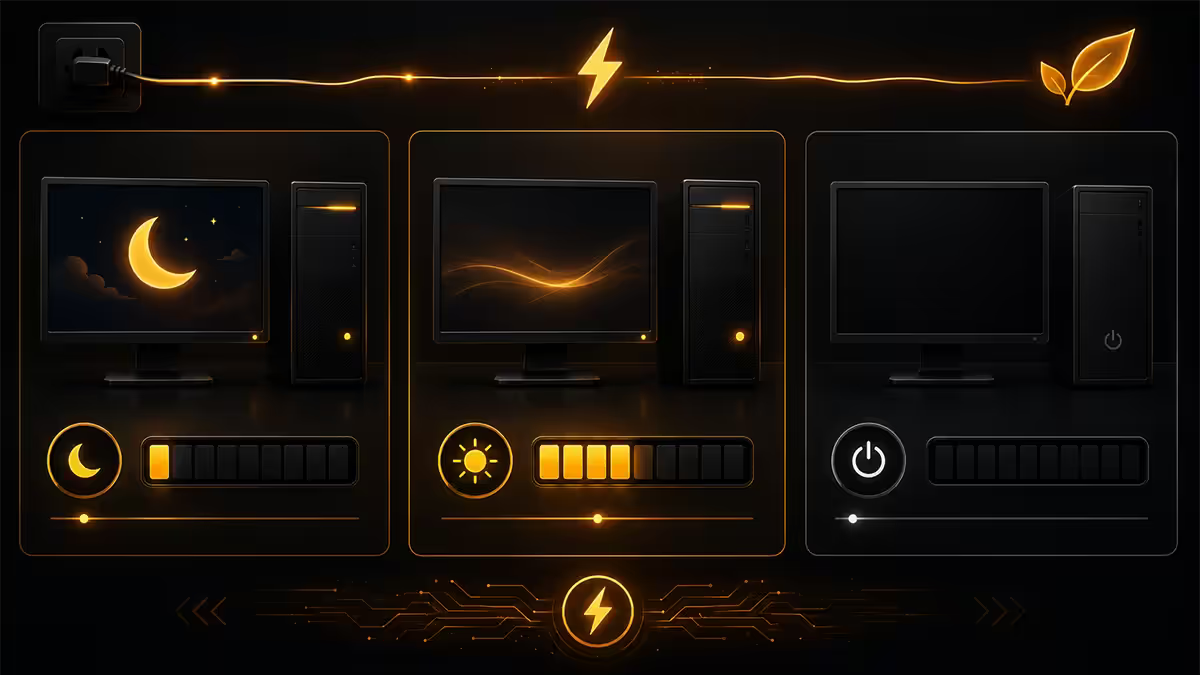
The single largest electricity waste in most gaming households isn't gaming — it's leaving the PC running idle 24/7.
A PC at idle (logged in, screen on, doing nothing) draws around 75W. Multiply by 24 hours, 30 days: 54 kWh/month, or R190/month of pure waste if nobody is using the machine.
Sleep (S3 / Modern Standby) draws 2-5W. Same period: 2 kWh/month, R7. Shutdown draws ~0.5W from the PSU's standby circuit. Same period: 0.3 kWh, R1.
The old "shutting down wears parts faster" worry was true for HDDs spinning up. SSDs tolerate thousands of power cycles. Modern motherboard capacitors are designed for daily cycling. Use sleep for breaks under 4 hours; shut down overnight unless you're downloading or rendering.
Undervolting — 18% off the gaming bill
Modern CPUs and GPUs ship with a generous voltage margin to guarantee stability across silicon-quality variance. Most chips will happily run stable at 50-100mV less than factory voltage. Less voltage = less power = less heat = less noise = lower bill.
GPU undervolting: in MSI Afterburner, drop core voltage by 50-80mV and lock the boost clock at the factory value. An RTX 5070 Ti at stock draws 220W average gaming; well-undervolted, 175W average. Same FPS, sometimes higher (no thermal throttle).
CPU undervolting (PBO Curve Optimizer on Ryzen, Intel XTU/Throttlestop on Intel): -10 to -20 on AMD CO. CPU draw drops 15-25W under load.
Combined: 18-22% reduction in gaming-load wall draw is realistic on most modern systems with an afternoon of tuning. On a R225/month enthusiast bill, that's R40-R50 per month back, or roughly R500-R600 per year.
FPS cap at refresh rate minus 3-5: a separate ~30-50W gaming saving on uncapped systems. Combine with adaptive sync. Free.
UPS, load shedding and the hidden costs
A UPS keeps your build alive through load shedding. It also draws standby power 24/7 and has charge-cycle inefficiencies. Worth knowing the real costs.
Typical 1500VA UPS draws 25-40W when charging, 10-20W in standby. About 11 kWh/month = R40 in pure UPS overhead, even if there's never a load shed event. Worth it for the data protection, but it's not free.
Sizing for your build: a 350W mid-range gaming PC + monitor + router + ONT (~430W total) runs about 30 minutes on a 1500VA / 900W lithium UPS. Long enough to save your game and shut down cleanly. A 600W+ enthusiast build needs a 2200VA+ UPS or a portable power station (EcoFlow, Bluetti) for the same runtime, costing R8-R12k more.
An efficient build pays off less in monthly Rands and more in UPS sizing. A 400W system on a R3k UPS rides through Stage 4 load shed. A 700W system needs a R10k inverter. Real-world energy efficiency in SA is partly about not needing to spend on UPS overhead.
Across <strong>200,000+ custom builds we've shipped from Centurion</strong>, we've measured wall draw on every popular SA build configuration. The result: <strong>real gaming PC electricity cost is typically a third of what customers expect</strong>. The forum drama around "RTX cards are eating my bill" doesn't survive a R250 plug-in wattmeter. If you want to know your actual cost, measure it for a week. If you want to lower it: enable sleep mode, cap FPS to monitor refresh, and undervolt once. Those three steps deliver more than any PSU upgrade.
Evetech Hardware Team · From our Centurion service bench
Key takeaways
- A mid-range gaming PC costs R110-R140/month at typical SA 2026 tariffs — much less than forum mythology claims.
- Eskom IBT charges R2.85-R4.40/kWh depending on monthly block; most gaming hours run at R3.50/kWh.
- Sleep mode saves R200/month versus 24/7 idle. Biggest free win available.
- Undervolt + FPS cap cut gaming load 15-20% with no FPS loss. R500-R600/year saved.
- Efficient builds matter less for kWh bill and more for UPS sizing and load-shed runtime.
Frequently asked questions
How much does it cost to run a gaming PC in South Africa per month?
Mid-range PC (350W gaming) at 3 hrs/day: R100-R140/month. High-end (550W) at 4 hrs/day: R180-R240. Add R20-R40 for monitor and peripherals.What's the actual wattage of a gaming PC at idle vs gaming?
Mid-range: 60-90W idle, 280-380W gaming. High-end: 100-130W idle, 450-580W gaming. Use a plug-in wattmeter for your specific number.How is Eskom's IBT tariff calculated in 2026?
Block 1 (0-350 kWh): ~R2.85/kWh. Block 2 (351-600): ~R3.35. Block 3 (601-1000): ~R3.85. Block 4 (1001+): ~R4.40. Plus VAT and service charges.Does an efficient PSU actually save money in SA?
Yes but slowly. Bronze → Gold saves ~R130/year, payback 5-7 years. Pick Gold for cooler/quieter operation, not electricity savings.How much does undervolting save on electricity in SA?
12-22% gaming load reduction with no FPS loss. About R95/month back on a 400W system at 3 hrs/day — R1,100/year for one afternoon of tuning.Should I put my gaming PC to sleep when not using it?
Yes — sleep is essentially free. Idle 24/7 costs R200/month of pure waste. Sleep when stepping away for 30+ min; shut down overnight.When does an energy-efficient build pay for itself in SA?
Pure electricity payback rarely justifies efficiency premiums. The real wins are heat output, noise, and UPS sizing for load shedding.Does running games at higher FPS draw significantly more power?
Yes — uncapped FPS can pull 30-60W more than capped. Capping to monitor refresh rate + G-Sync saves R15+/month and improves frame pacing.
Get the Evetech app
Exclusive app-only prices, daily flash sales, and free delivery on orders over R4,000 — download the app and start saving.