Gaming Performance · Metrics
What is frame time? And why it matters more than FPS. — Average lies. Variance is everything.
The number on the OSD says 90 FPS. The game feels like it's tripping over itself. The trick is in the milliseconds between frames — and average FPS is the one number that hides it.
- 60 FPS frame
- 16.6 ms
- 120 FPS frame
- 8.3 ms
- 240 FPS frame
- 4.2 ms
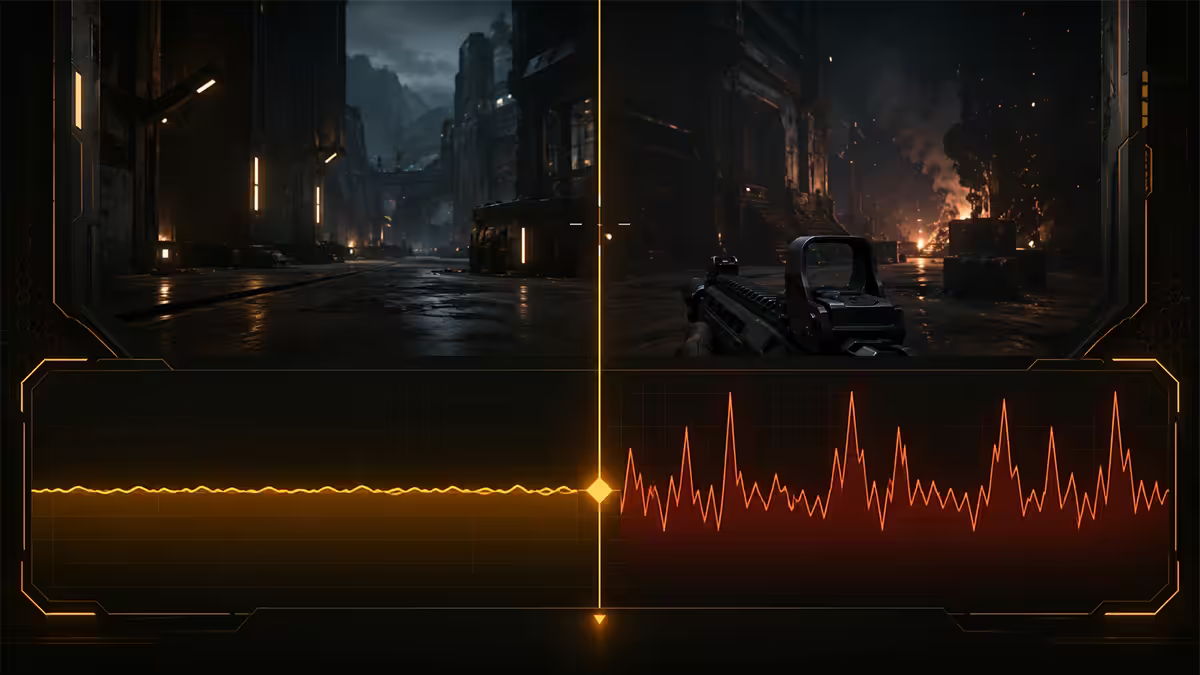
Why average FPS lies about your experience
Open any benchmark video. The headline number is average FPS. The reviewer tested a GPU at 4K Cyberpunk and reports 78 FPS average. You buy the GPU. The game runs at "78 FPS" according to your overlay. But it feels jerky. Movement isn't smooth. Camera turns hitch. The number is right; the experience is wrong.
The problem is that FPS is a one-second average. It tells you how many frames the GPU produced in the last 1000 milliseconds — but it tells you nothing about whether those frames arrived evenly. Two scenarios produce identical 78 FPS averages:
- Smooth scenario. Every frame took roughly 12.8 ms. The graph is a flat line. You see fluid motion.
- Stutter scenario. Most frames took 8-10 ms but every fifth frame took 35-40 ms. Average is still 78 — but your eyes see severe interruptions at 5 Hz.
Frame time is the per-frame measurement. It's stored in microseconds and reported in milliseconds. A frame time graph plots ms-per-frame across the benchmark window. Smooth gameplay produces a flat line. Stuttery gameplay produces a spiky line. The graph doesn't lie — averages do.
1% low and 0.1% low — the metrics that matter
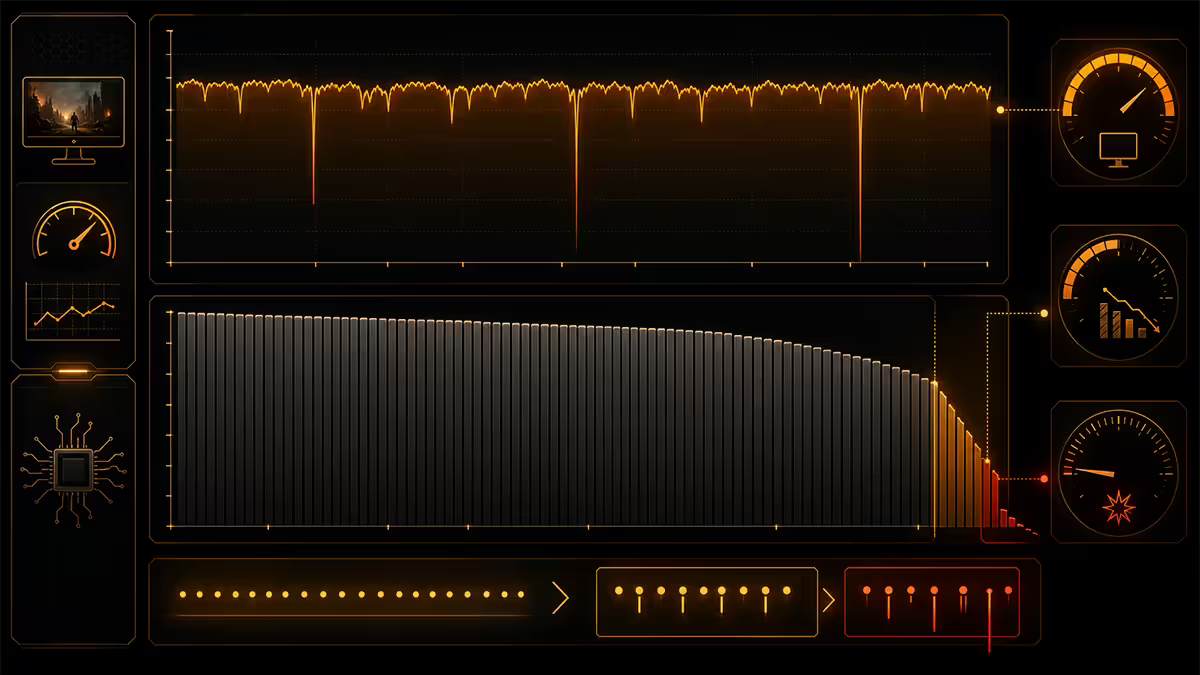
Modern benchmarks include three metrics: average FPS, 1% low and 0.1% low. The naming sounds technical but the meaning is simple.
1% low is the average FPS of the slowest 1% of frames in your benchmark window. If you played for 10 minutes, the 1% low is roughly the framerate of the worst 6 seconds. It captures the broad pattern of slowdowns — heavy crowd scenes, draw-distance pop-ins, intense effects.
0.1% low is the average FPS of the slowest 0.1% of frames. In the same 10-minute window, it's the worst ~0.6 seconds. This is where you see micro-stutters — shader compilation hitches, texture streaming pop-ins, frame pacing failures, background process spikes. 0.1% low is the most ruthless honesty metric in benchmarking.
| What it shows | Healthy ratio | Bad ratio |
|---|---|---|
| Average FPS | Headline number | Tells you nothing alone |
| 1% low vs average | ~75-85% of average | <60% — frequent stuttering |
| 0.1% low vs 1% low | 5-15 FPS gap typical | 20+ FPS gap = severe micro-stutter |
| 0.1% low vs average | ~60-70% of average | <40% — unplayable hitches |
A real-world example: an RTX 5070 on Cyberpunk 2077 at 1440p Ultra with DLSS Quality shows 95 FPS average, 78 FPS 1% low, 70 FPS 0.1% low on an AM5 + DDR5-6000 system. That's a healthy spread — the 0.1% low at 73% of average means the experience is consistently smooth even at the worst moments. Compare to the same GPU on a single-channel RAM build: 95 FPS average, 42 FPS 1% low, 24 FPS 0.1% low. The average looks identical; the experience is broken.
What each frame time threshold actually feels like
Frame time in milliseconds maps to perceived smoothness. The thresholds are well-studied:
| Frame time | FPS equivalent | How it feels |
|---|---|---|
| 33.3 ms | 30 FPS | Cinematic. Console feel. Camera movement is the bottleneck for sensitivity. |
| 22.2 ms | 45 FPS | Playable but visible motion sampling. Acceptable for single-player. |
| 16.6 ms | 60 FPS | The standard. Comfortable for everything except competitive FPS. |
| 13.9 ms | 72 FPS | Noticeably smoother than 60 — the first major step up. |
| 11.1 ms | 90 FPS | VR baseline. Significantly smoother than 60. |
| 8.3 ms | 120 FPS | High-refresh sweet spot. Smooth even in fast motion. |
| 6.9 ms | 144 FPS | Competitive baseline. Marginal feel improvement over 120. |
| 4.2 ms | 240 FPS | Esports tier. Diminishing returns versus 144 for non-pros. |
| 2.1 ms | 480 FPS | Top esports. Sub-perceptual gain over 240 in most titles. |
The non-linearity matters: going from 60 to 120 FPS halves frame time by 8.3 ms — a massive perceived improvement. Going from 240 to 480 FPS only saves 2.1 ms — barely noticeable except in twitch shooters at the absolute top of competitive play.
This is why "144 Hz is the sweet spot" is more than marketing. The frame time delta between 60 and 144 is 9.7 ms — perceptually transformative. The delta between 144 and 240 is 2.7 ms — meaningful but not transformative. The delta between 240 and 480 is 2.1 ms — into placebo territory for most gamers.
Reading frame time variance graphs
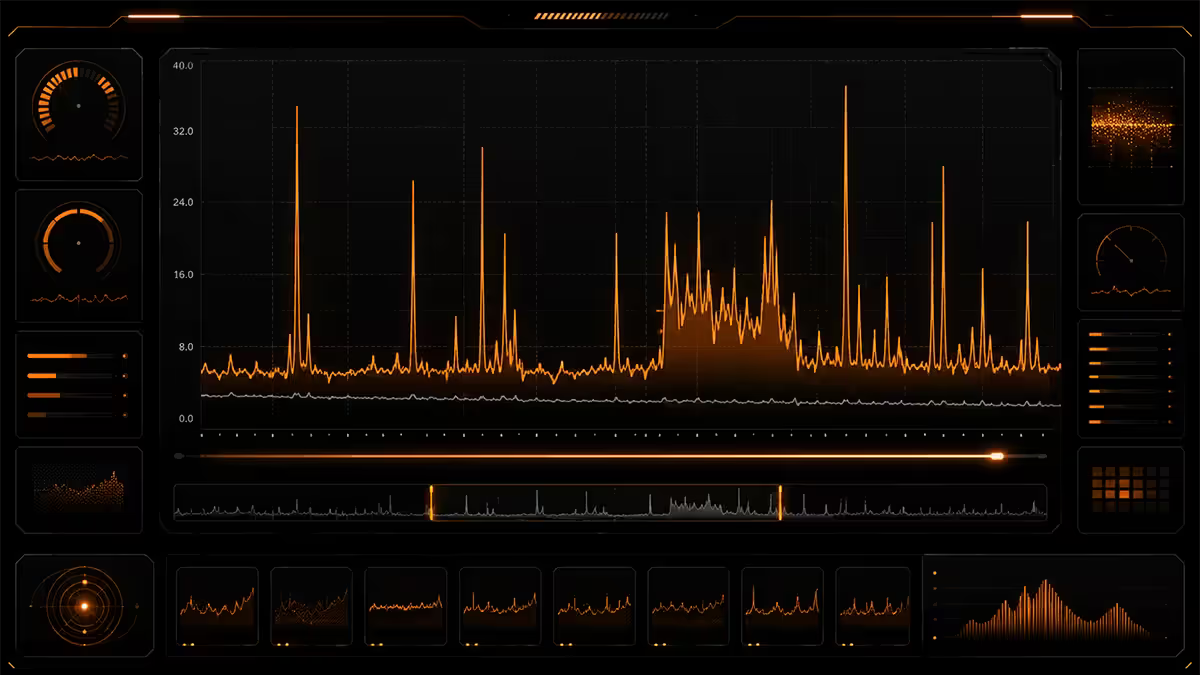
When you open CapFrameX or PresentMon output, you'll see a graph that plots frame time on the Y axis (ms) against time on the X axis (seconds). Learning to read these graphs takes 10 minutes and saves you hundreds of rands of misdirected upgrades.
The healthy line. A consistent thin band — say 12-14 ms wide for a 90 FPS scenario — with no isolated spikes. Slight variance is normal; the human eye won't catch ms variation under ~3 ms.
The spike pattern. An otherwise flat line with isolated tall spikes every 5-30 seconds. These are discrete stutters — usually shader compilation, texture streaming, asset loading, or background processes (Discord spike, browser tab refresh, antivirus scan). Each spike represents a frame that took 5-10x longer than its neighbours.
The sawtooth pattern. A line that drifts upward then drops sharply, repeatedly. This is typically memory or VRAM saturation — frame times climb as the system runs out of resources, then the engine flushes or swaps and frame times briefly recover before climbing again.
The thick noise band. A wide band of variance with no clean centre line, like grass blowing in the wind. This is frame pacing failure — frames are arriving but the GPU isn't presenting them at consistent intervals. Common cause: VSync or VRR misconfiguration, or driver-level frame pacing bugs.
The cliff pattern. A clean line that suddenly steps up to a new higher plateau and stays there. This is a thermal throttle — the CPU or GPU hit a thermal limit and dropped clocks. The cliff is the moment throttling kicks in.
The measurement tools — CapFrameX, PresentMon, RTSS
CapFrameX (best benchmarking tool)
CapFrameX is free, open source and the de facto standard for performance benchmarking. Built on PresentMon, it adds a clean GUI for recording, comparing and analysing frame time captures. Record a benchmark run with a hotkey (F11 by default), review the results immediately — average, 1% low, 0.1% low, percentile distribution, frame time graph. Compare multiple recordings side-by-side. Export to CSV for further analysis.
For testing whether a driver update changed performance, whether your XMP profile actually improved gaming, or whether a thermal paste change reduced thermal throttling, CapFrameX is the tool. Install once, leave it minimised, hit F11 when you want to capture.
PresentMon (the data source)
PresentMon is Intel's open source command-line tool that hooks into DirectX, Vulkan and OpenGL presentation queues and records every frame's lifecycle — when CPU submitted the draw call, when GPU finished rendering, when DWM presented to display. It's the raw data source that CapFrameX, MSI Afterburner overlay and almost every modern benchmarking suite use under the hood. You generally don't need to use PresentMon directly unless writing your own tooling.
RivaTuner Statistics Server / MSI Afterburner
RTSS (bundled with MSI Afterburner, also standalone) is the best live-overlay tool. Configure it to display average FPS, 1% low, frame time graph, GPU usage, CPU usage, VRAM usage and temperatures during gameplay. For real-time awareness of whether your system is bottlenecking, RTSS is the tool. For benchmarking and comparison, switch to CapFrameX.
Setup tip: use RTSS in-game for awareness, CapFrameX for recorded benchmarks. They both read from the same PresentMon data source so they agree on the numbers.
CPU vs GPU bottleneck patterns in frame time
Frame time graphs reveal whether your CPU or GPU is the limiter — clearer than any single number can.
GPU-bound pattern. Frame time is consistent at the level dictated by GPU power. The line is mostly flat. GPU usage shows 95-99% in your overlay. CPU usage shows moderate (40-70% on a few threads). Resolution and graphics settings dominate frame time — drop resolution or settings and frame time drops with it.
CPU-bound pattern. Frame time has rhythmic variance tied to scene complexity. Crowd scenes spike, empty scenes recover. GPU usage drops below 90% during the spikes. A single CPU thread is pegged at 95-100% during heavy moments. Lowering graphics settings doesn't help — you're not waiting for the GPU. Lower resolution doesn't help either. The fix is CPU upgrade, faster RAM (especially on AM5 where DDR5-6000 EXPO matters more than people realise) or in some cases enabling DLSS Frame Generation which adds GPU-generated frames between CPU-bottlenecked real frames.
Mixed bottleneck pattern. Frame time variance that doesn't cleanly correlate with either resolution or scene complexity. This is the most common real-world pattern — different game sections shift the bottleneck. Tools like CapFrameX flag this by showing GPU usage variance across the recording.
How to fix frame time spikes
Once you've identified a spike pattern, the fix depends on the cause.
- Shader compilation stutter. Common in new releases (UE5 games especially). Solutions: enable shader pre-compilation in game settings if available, let the game compile shaders during a slow first hour of play, or wait for a patch. Newer drivers also pre-compile shaders during installation on supported titles.
- Texture streaming hitches. Caused by VRAM saturation or slow storage. Solutions: lower texture quality (free), upgrade to NVMe SSD if running on SATA SSD or HDD, increase VRAM budget by closing browser tabs and Discord that fight for VRAM, or upgrade GPU if VRAM is the limit (8GB cards now struggle at 1440p+ in modern titles).
- CPU bottleneck spikes. Heavy AI, crowd scenes, physics. Solutions: enable XMP/EXPO if not already (huge AM5 difference), upgrade CPU one tier, enable DLSS/FSR Frame Generation if supported, lower draw distance settings.
- Background process interference. Discord overlay updates, browser refreshing tabs, Windows Defender scans, OneDrive syncing. Solutions: close non-essential apps before gaming, exclude games from Defender real-time scanning, disable in-game overlays (Discord, NVIDIA Experience, Game Bar).
- Memory swap to pagefile. System RAM saturated, swapping to SSD. Solutions: close memory-hungry apps, upgrade from 16GB to 32GB RAM, identify memory-leaking applications via Task Manager.
- Thermal throttling. CPU or GPU hitting thermal limit. Solutions: improve case airflow, upgrade cooler, re-paste CPU, undervolt if comfortable, check fan curves for premature ramp-down.
Key takeaways
- FPS is an average. Frame time is the per-frame truth. The graph doesn't lie.
- 60 FPS = 16.6 ms · 120 = 8.3 ms · 240 = 4.2 ms. Diminishing returns above 144.
- 1% low = average of slowest 1% of frames. 0.1% low = the worst micro-stutters.
- Variance is the enemy. Locked 60 feels smoother than spiky 90.
- CapFrameX for benchmarking, RTSS for live overlay. Both use PresentMon underneath.
- Cap framerate to refresh-rate minus 3, enable VRR. Consistency beats peak.
- Measure before you upgrade. The graph tells you which component to buy.
Frequently asked questions
What is frame time?
The duration in milliseconds that the GPU and CPU spent producing a single frame. FPS is the average across one second. Frame time exposes per-frame variance that averages hide.What's the relationship between FPS and frame time?
Frame time in ms = 1000 ÷ FPS. 60 FPS = 16.6 ms. 120 = 8.3 ms. 240 = 4.2 ms. The relationship is inverse and non-linear — diminishing returns set in above 144 FPS.What does 1% low FPS actually mean?
The average FPS of the slowest 1% of frames in the benchmark window. Measures how badly the framerate dips. 80 FPS average with 30 FPS 1% low feels worse than 60 average with 55 1% low.What's the difference between 1% low and 0.1% low?
1% low = slowest 1% of frames (broad stutter pattern). 0.1% low = slowest 0.1% (worst micro-stutters). Healthy gap is 5-15 FPS. Large gap = severe spikes needing diagnosis.What frame time feels smooth?
Consistency, not absolute value. A locked 16.6 ms feels smoother than 12 ms with 4-25 ms variance. The human visual system is sensitive to frame time inconsistency. Cap framerate to match your refresh rate minus 3 with VRR enabled.How do I measure frame time?
CapFrameX (best UI for benchmarking, free), PresentMon (Intel's CLI data source), RTSS/MSI Afterburner (live overlay during gameplay). Use CapFrameX for benchmark sessions, RTSS for live awareness.What causes frame time spikes?
In order: shader compilation, texture streaming, CPU bottleneck during heavy scenes, background processes, memory pagefile swap, VSync handshake issues, thermal throttling. Each leaves a distinct graph signature.Is 60 FPS with spikes worse than locked 50 FPS?
Yes, almost always. Spikes break visual smoothness severely. A consistent 50 FPS feels predictable and smooth, especially with VRR. A 60 average with dips to 30 feels jerky and unfinished.
Get the Evetech app
Exclusive app-only prices, daily flash sales, and free delivery on orders over R4,000 — download the app and start saving.