Windows Power Guide
Task Manager like a pro.
— Six tabs, no mystery, no superstition. Built into every Windows install since 1996 and still the fastest way to diagnose most PC performance problems. Most users open the Processes tab, click End Task and close it. There's a lot more underneath.
- fastest open
- Ctrl+Shift+Esc
- Win11 24H2
- 7 tabs
- boot time saved
- 30-60s
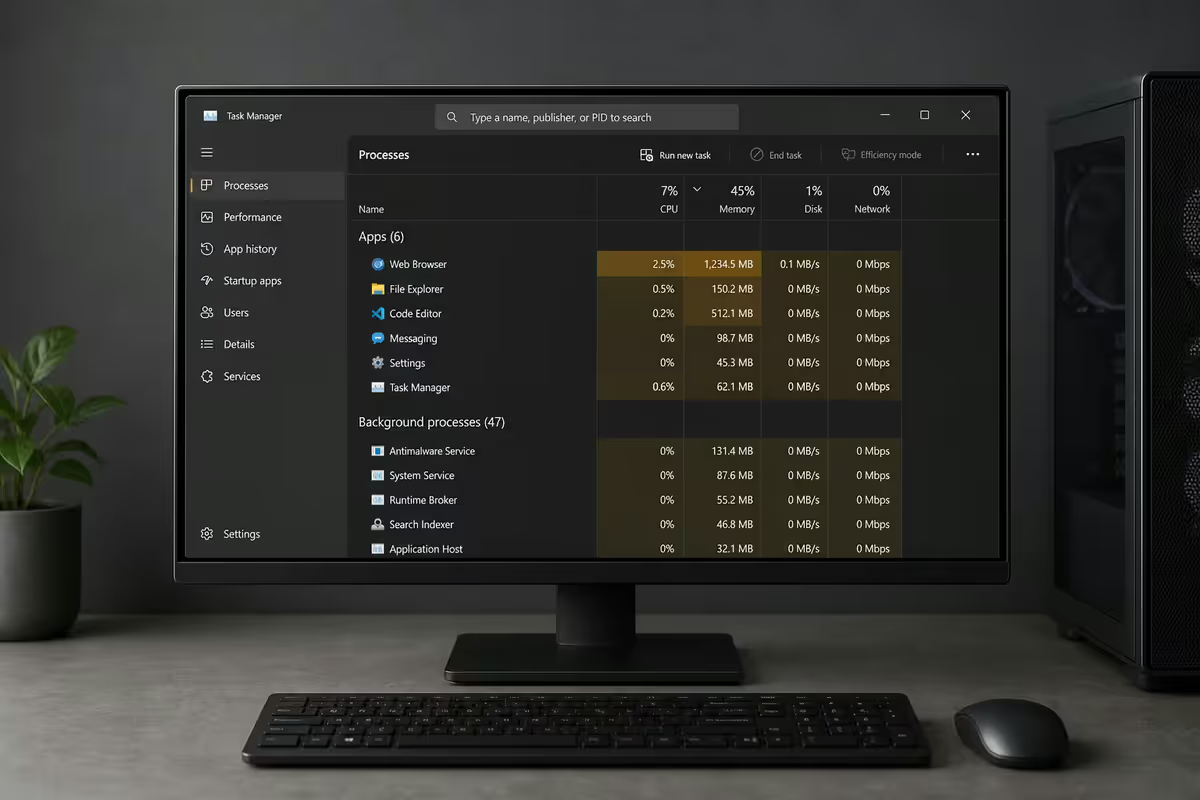
Opening Task Manager fast
The keyboard shortcut every IT professional uses: Ctrl+Shift+Esc. Direct, no menus, no security screen detour.
Other options:
- Ctrl+Alt+Del → Task Manager (slow, security screen first).
- Right-click taskbar → Task Manager (Win10).
- Right-click Start button → Task Manager (Win11).
- Win+X → T (the keyboard navigation through the power user menu).
- Run dialog (Win+R) →
taskmgr.
If a fullscreen game has crashed and the taskbar is unreachable, the security screen route (Ctrl+Alt+Del) is your fallback — it works when other shortcuts don't, because it goes via the Secure Attention Sequence.
The Performance tab — live monitoring
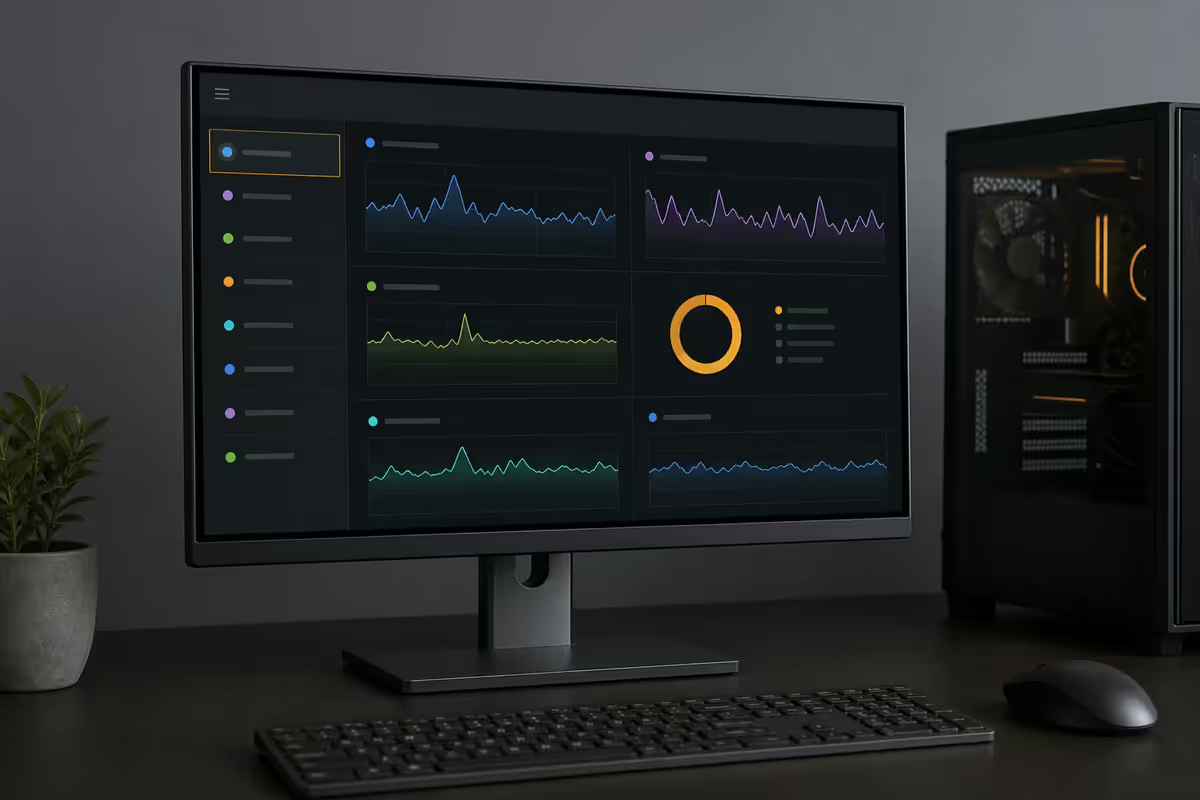
The Performance tab is the most underused power feature in Task Manager. It shows live sparklines for every major system resource:
- CPU — overall utilisation + clock speed + uptime. Right-click the graph > Change graph to > Logical processors for per-thread view (essential on Ryzen 9 / Core Ultra 9 machines).
- GPU — utilisation broken down by engine (3D, Copy, Video Encode, Video Decode, Compute). Multi-GPU systems show separate panels.
- Memory — used / available / committed / cached, plus DDR speed, slots used and form factor.
- Disk — separate panel per drive, read/write throughput, active time. Useful for diagnosing 100% disk usage spikes.
- Ethernet / Wi-Fi — throughput, signal strength, adapter type. Win11 24H2 added Wi-Fi 7 specifics.
- NPU (Win11 24H2, Copilot+ PCs only) — Neural Processing Unit utilisation for on-device AI workloads.
Processes tab — sort tricks that matter
The Processes tab is what most users open first. Click any column header to sort ascending/descending. The columns that actually matter:
| Column | What to look for | Right-click → enable? |
|---|---|---|
| Name | Default — grouped by app type | Default on |
| CPU | Sort descending to find runaway processes | Default on |
| Memory | Browser tabs and Electron apps often top this | Default on |
| Disk | Diagnose 100% disk spikes (often Windows Update) | Default on |
| Network | Find background bandwidth hogs | Default on |
| GPU | Spot GPU-accelerated apps (Chrome, Discord, OBS) | Default on (Win11) |
| GPU engine | Which GPU engine (3D vs encode) per process | Right-click columns to enable |
| Power Usage | Battery drain culprits (laptops) | Right-click columns to enable |
| Power Usage Trend | Sustained vs spike — laptops | Right-click columns to enable |
End Task vs End Process Tree. End Task (right-click → End Task or button bottom-right) sends the program a graceful close request — it can save unsaved work first. End Process Tree (Details tab, right-click) kills the parent and every child process immediately. Use the graceful version first. Only escalate to End Process Tree when a hung app spawned helper processes (browser tabs, video editor render workers, game launchers).
Details tab — Set Affinity and Set Priority
The Details tab is what older Windows called the Processes tab — it shows raw process names (chrome.exe, notepad.exe) rather than friendly app groupings. Right-click any process to access the power-user moves.
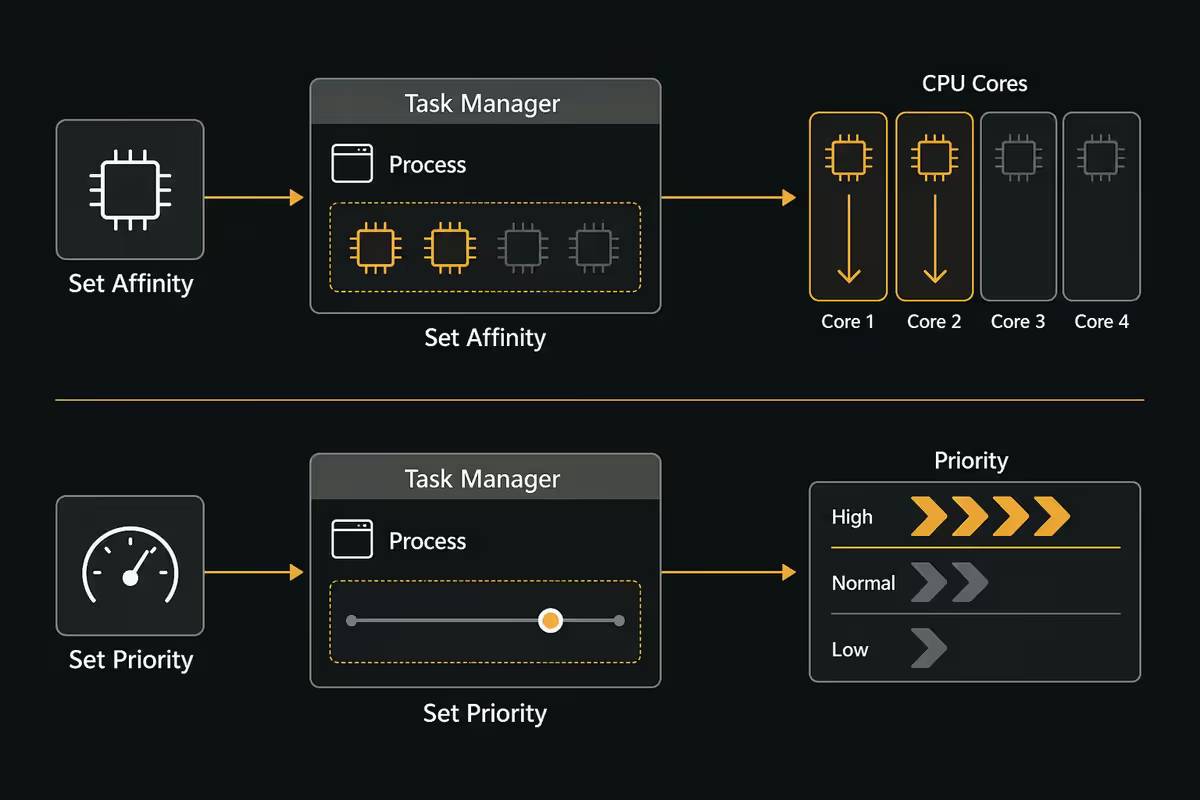
Set Affinity
Right-click → Set Affinity → tick/untick specific CPU cores. The process will only be allowed to run on the cores you leave ticked. Practical uses:
- Older single-threaded games that get confused by 16+ core CPUs — restrict to cores 0-7.
- Benchmarking — restrict background apps to cores 0-1 while the benchmark runs on 2-N.
- P-core / E-core separation on Intel 12th-14th gen — restrict a latency-sensitive app to the P-cores only.
- Buggy software that crashes on hybrid CPU layouts.
Affinity resets when the process restarts. For permanent affinity, use the command line tool start /affinity or Process Lasso (third-party).
Set Priority
Right-click → Set Priority. Options: Realtime, High, Above Normal, Normal, Below Normal, Low. Windows defaults everything to Normal. Bumping a game to High can smooth frametimes on multi-tasked systems. Never set Realtime — it can starve mouse/keyboard input.
Other useful right-click menus
- Go to service(s) — jumps to the service hosted in a svchost.exe instance.
- Open file location — opens File Explorer at the process's .exe.
- Properties — shows file version, digital signature, publisher (useful for malware detection).
- Search online — Bing search the process name (useful for unknown processes).
- Create dump file — full memory dump for crash analysis.
Startup apps — triage for boot time
The Startup apps tab (Win11) / Startup tab (Win10) lists every program registered to auto-launch when Windows boots. Each gets an Impact rating — None, Low, Medium or High — based on how long it delays the boot process.
Triage rules:
- Disable High impact items you don't actively need on boot — Spotify, Adobe Creative Cloud, Discord, Steam (yes, even Steam), OneDrive, OEM utilities like ASUS Armoury Crate and MSI Center.
- Keep enabled: Windows Security, your AV software (if not Defender), audio drivers (Realtek HD Audio Manager, NVIDIA Audio), graphics card overlay if you use it (NVIDIA Overlay, AMD Adrenalin).
- Investigate before disabling: anything you don't recognise — could be a service you need, or could be malware.
- "Not measured" items — usually rarely-launched or new entries. Watch them; they often become High after a reboot.
A clean startup list typically cuts boot time by 30-60 seconds on a normal Windows 11 install with the usual creep of OEM bloatware. The most aggressive trim (only essential drivers and AV) can hit sub-15-second boots on an NVMe Gen 4 SSD.
Services tab — quick toggle vs full services.msc
The Services tab in Task Manager is a quick-start/quick-stop interface for Windows Services. It shows Name, PID, Description, Status (Running / Stopped) and the service Group. Right-click → Start / Stop / Restart for immediate action. Click "Open Services" at the bottom to launch the full services.msc MMC console.
When to use Task Manager's Services tab: quick restart of a stuck print spooler, brief diagnosis of which service is hogging a svchost.exe instance, fast service stop without launching services.msc.
When to use services.msc instead: changing startup type (Automatic / Manual / Disabled), modifying Log On as identity, configuring Recovery actions, viewing service dependencies. Task Manager only does run-state, not configuration.
Upgrade to Process Explorer for real power use
For routine triage, Task Manager is fine. For deep performance forensics, malware investigation or system administration, replace it with Process Explorer from Microsoft Sysinternals. Free, signed, IT-team-trusted for 25 years.
What Process Explorer adds:
- Full process tree with parent/child relationships visualised as nested indentation.
- Hover tooltips with command-line arguments — see exactly what flags a process was launched with.
- VirusTotal integration — right-click any process, "Check VirusTotal" to query 70+ AV engines.
- Handle and DLL view — see exactly which files / registry keys / mutexes a process has open. Solves "this file is in use" mysteries.
- Verify signer — colour-coded indicator of signed vs unsigned binaries (catches injected DLLs).
- System Information panel with broader sensor data than Task Manager.
Drop procexp64.exe into C:\Tools and pin it to your Start menu. Run as administrator on first launch and accept the EULA. Then go to Options > Replace Task Manager — Ctrl+Shift+Esc now launches Process Explorer everywhere Task Manager used to.
Our service techs at Centurion use Task Manager for the first 60 seconds of every diagnostic call — Performance tab visible, Processes tab sorted by CPU. Most "my PC is slow" tickets resolve to a single runaway process (Windows Search Indexer, an OEM updater stuck in retry, Antimalware Service Executable scanning) you can identify in under a minute. The rest reveal in the Performance tab — sustained 100% disk usage, GPU memory leak (browser hardware acceleration), or a network adapter saturating at suspicious upload rates. Task Manager is the diagnostic tool we open before Event Viewer, before Reliability Monitor, before resetting anything.
Behind the Build · From our service desk
Key takeaways
- Ctrl+Shift+Esc is the only Task Manager shortcut you need. Faster than menus, no security screen.
- Performance tab → live CPU/GPU/RAM/Disk/Wi-Fi/NPU sparklines. Detach to Summary view for always-on monitor.
- Enable Power Usage + Power Usage Trend columns on laptops. Best battery drain forensics built into Windows.
- Details tab → right-click → Set Affinity for hybrid CPU bugs, Set Priority for hand-tuning. Never Realtime.
- Triage Startup apps for 30-60 seconds of boot time back. Replace Task Manager with Process Explorer for real power work.
Frequently asked questions
What is the fastest way to open Task Manager?
Ctrl+Shift+Esc. Direct shortcut with no security screen or menu. Works on every Windows version from 7 onward.How do I monitor CPU and GPU usage at the same time?
Performance tab shows live sparklines for CPU, GPU, Memory, Disk, Ethernet, Wi-Fi and NPU simultaneously. The GPU panel breaks down 3D, Copy, Video Encode and Video Decode engines.What is the difference between End Task and End Process Tree?
End Task sends a graceful close signal — the app can save work first. End Process Tree forcibly kills the parent and all child processes immediately. Use End Task first, escalate only when needed.What does Set Affinity do in Task Manager?
Limits which CPU cores a process can run on. Useful for older single-threaded games on high-core CPUs, P-core/E-core separation on Intel hybrid chips, and isolating benchmarks. Resets when the process restarts.How do I find what is slowing my PC down?
Open Task Manager > Processes > click CPU column to sort descending. Repeat for Memory, Disk, Network. For GPU diagnosis, switch to the Performance tab. Power Usage column on laptops finds battery drain culprits.What is the Startup tab and what should I disable?
Lists every program set to auto-launch on Windows boot, with Impact ratings. Disable High-impact items you don't actively need (Spotify, Adobe CC, Discord, OEM utilities). Keep Windows Security and AV enabled.Is Process Explorer better than Task Manager?
Yes for power users. Adds full process tree, command-line arguments, VirusTotal integration, handle/DLL inspection. Free from Sysinternals. Can replace Task Manager entirely via Options > Replace Task Manager.What new features did Windows 11 24H2 add?
Power throttling indicator, per-process GPU engine breakdown, NPU monitoring for Copilot+ PCs, Wi-Fi 7 throughput graphs, Light Mode UI, real-time DirectStorage transfer rate.